Stop Reactive Hiring: Field Service Capacity Planning for Ops
Stop Reactive Hiring: Field Service Capacity Planning for Ops
Field service capacity planning is the process of matching technician hours, skills, and equipment to forecasted demand over weeks or months, not just filling tomorrow’s schedule. The first move: calculate baseline capacity by dividing available minutes per technician by the combined time on site and travel minutes per job. Everything below, from the exact formula to the metrics worth tracking, builds on that one number.
TL;DR:
- Proper capacity planning requires calculating available productive technician minutes after subtracting travel, administrative, and training time, not just headcount.
- Metrics like utilization rate, first-time fix rate, backlog age, and travel time share help identify capacity constraints and territory design issues.
- To determine staffing needs, divide forecasted jobs by the number of jobs a technician can handle daily, adjusting for availability factors, skill categories, and unexpected surges.
- Use seasonal adjustments, scenario analysis, and AI-driven models for long-term demand forecasting, especially when demand shows high variability.
- Effective tools should offer capacity-based resource settings, real-time dashboards, constraint-aware scheduling, and seamless integration with HR and parts systems for resilience.
Table of Contents
- What Field Service Capacity Planning Actually Covers
- Key Capacity Components and Metrics to Track
- How to Calculate Field Service Capacity: Formula and Example
- Forecasting Approaches: Matching the Model to the Volatility
- Tool Features That Actually Move the Needle on Capacity
- Common Pitfalls and Best Practices for Resilient Plans
- How Predictive Analytics Sharpens Capacity Decisions
- Where to Start This Quarter
- Where to Dig Deeper on Capacity Planning
- Sources
- FAQ
What Field Service Capacity Planning Actually Covers
Capacity planning and scheduling get treated as the same job. They aren’t. Scheduling answers “who goes where tomorrow?” Capacity planning answers “do we have enough of the right people, with the right skills, three months from now?” Capacity planning is strategic workforce planning that determines headcount and skill mix over a defined horizon, while scheduling assigns already-available resources to today’s jobs.
Run capacity planning on a monthly or quarterly cycle, with input from operations leadership, dispatch supervisors, and finance. Waiting until backlog spikes to ask the staffing question guarantees a reactive answer.
Three outcomes should drive the exercise:
- Service level: the percentage of jobs completed within the promised window.
- First-time fix rate (FTFR): jobs resolved without a return visit, a direct signal of whether technicians are matched to the right skill requirements.
- Cost per call: labor and travel cost per completed job, which rises fast when overtime fills capacity gaps instead of planned hires.
Get this cycle right and staffing decisions stop being guesswork tied to whoever is loudest in the Monday meeting.
Key Capacity Components and Metrics to Track
A capacity number is only as good as the inputs behind it. Raw headcount tells you almost nothing. What matters is available productive minutes after subtracting travel, administrative work, breaks, and training time. Skill constraints and equipment availability often cap capacity tighter than technician hours do. Job density and travel time variability can impose a lower ceiling than raw labor hours ever would, which is why two regions with identical headcount can produce very different completion rates.
| Metric | What it measures | Why it matters |
|---|---|---|
| Utilization rate | Productive hours ÷ available hours | Flags overbooking or idle capacity |
| First-time fix rate | Jobs closed without a repeat visit | Signals skill-to-job matching quality |
| Backlog age | Average days a job sits unassigned | Early warning for capacity shortfalls |
| Average job time | Time on site per job type | Base input for the capacity formula |
| Travel time share | Travel minutes ÷ total shift minutes | Reveals territory design problems |
Utilization consistently above a high threshold for long stretches usually means no slack for emergency calls. Utilization consistently low suggests overstaffing or a territory boundary that needs redrawing.
How to Calculate Field Service Capacity: Formula and Example
The core formula is simple enough to run in a spreadsheet this afternoon:
- Jobs per technician per day = available minutes ÷ (time on site + travel minutes)
- Total daily capacity = jobs per technician per day × number of technicians
- Required technicians = (total forecasted jobs per day ÷ jobs per technician) ÷ availability factor
The availability factor accounts for vacation, sick time, training, and no shows, typically expressed as a decimal below 1.0.
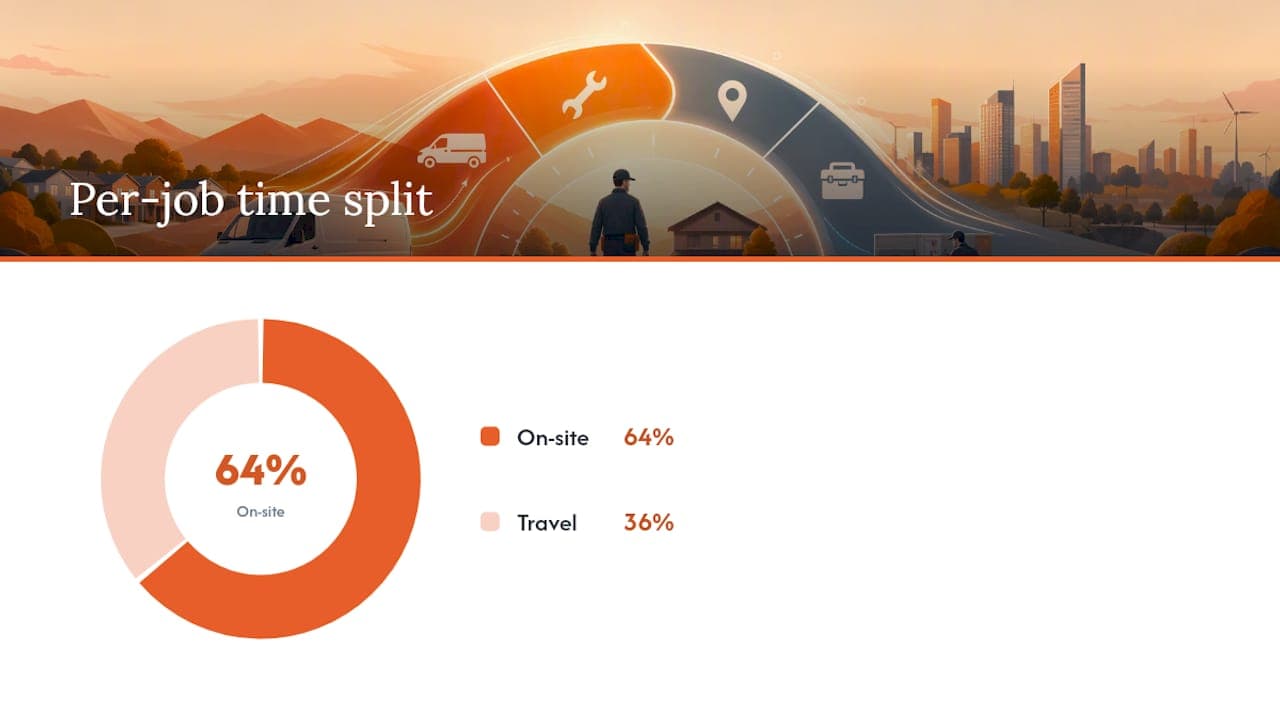
Here’s a worked example. A technician works a 480 minute shift. Average time on site runs 45 minutes; average travel time between jobs runs 25 minutes. That’s 70 minutes per job, giving roughly 6.8 jobs per technician per day. If your forecast calls for 68 jobs a day, you’d need 10 technicians at full availability. Apply an availability factor of 0.85 to account for time off and training, and the real requirement rises to about 12 technicians.
Pro Tip: Run this calculation separately for each skill category (HVAC, electrical, network) rather than as one blended average. A single blended number hides shortages in your highest-demand skill.
Add some extra capacity before finalizing the number, as a precaution to handle unexpected demand surges. Skipping that step is the single most common reason capacity plans fail during the first busy week.
Forecasting Approaches: Matching the Model to the Volatility
Short-term forecasting, covering the next one to four weeks, works fine with moving averages built from the last several cycles of job data. Long-term forecasting, covering a quarter or more, needs seasonal adjustment layered on top, because demand for an HVAC company in July looks nothing like demand in February.
Building the model out further:
- Use moving averages for stable, low-variability demand like routine maintenance contracts.
- Layer in seasonal indices when weather, holidays, or promotional campaigns swing volume predictably.
- Run scenario analysis (best case, base case, surge case) when a single forecast number would leave the plan exposed.
- Reserve stochastic or AI-driven models for high-variability networks where manual forecasting consistently misses.
IBM Research’s work on service-delivery modeling describes a comprehensive analytical methodology that produced predictive insight and prescriptive staffing recommendations across large-scale service deployments, with meaningful cost savings when applied consistently.
Pro Tip: *Test your forecast against last year’s actual demand before trusting it for the coming quarter.
Tool Features That Actually Move the Needle on Capacity
Most field service software claims to “support” capacity planning. Few actually give planners the controls that matter. Look for these specific capabilities rather than a generic feature list:
- Per-day capacity settings on individual resource records, so a technician’s daily job limit reflects their real skill and shift, not a company-wide average.
- Capacity-based resource definitions that prevent overbooking during automated schedule optimization. Salesforce’s field service platform, for example, documents capacity-based resources that let planners set exact per-day thresholds.
- Real-time capacity dashboards that flag when backlog age or utilization crosses a threshold, not just end-of-week reports.
- Constraint-aware automated scheduling that factors skill certification, equipment availability, and travel zones into every assignment.
- Integration with HR, payroll, and parts inventory systems, so the capacity view reflects who’s actually available and equipped today.
Workforce management platforms built around demand management, schedulers, and dispatchers tend to handle the coordination layer well; the capacity math still has to be set up correctly underneath it.
Common Pitfalls and Best Practices for Resilient Plans
The most common mistake is planning by headcount alone, without accounting for travel time, equipment limits, or skill certification gaps. A roster of 40 technicians means little if 15 of them are the only ones certified for your highest-volume job type.
- Adopt a baseline plus buffer model instead of staffing for peak demand year-round. Field service glossaries generally recommend a 10 to 20% buffer layered on top of baseline capacity, reserved for surges rather than baked into permanent headcount.
- Cross-train technicians across adjacent skill categories so a spike in one service line doesn’t strand jobs while another team sits idle.
- Redesign territories before adding algorithmic scheduling. Poor geographic clustering is often the real bottleneck, and no scheduling algorithm fixes a territory map that forces technicians to crisscross a region all day.
- Set a fixed review cadence and tie utilization and backlog metrics to team incentives, not just to a quarterly slide deck nobody revisits.
Pro Tip: Before adding permanent headcount, check whether a subcontractor network could absorb your seasonal peak. It’s often cheaper than carrying full-time capacity for three or four surge weeks a year.
Zinier’s field service research points to visibility, automation, and real-time reallocation as the practical combination that keeps plans resilient once demand actually diverges from forecast.
How Predictive Analytics Sharpens Capacity Decisions
Static spreadsheets forecast demand once a quarter. Predictive models update as new job data, weather feeds, and equipment health signals arrive, which matters most when demand swings fast. Practical use cases worth piloting include:
- Demand forecasting models that ingest historical job volume alongside external signals like weather or seasonal contracts.
- Dynamic routing adjustments that reallocate technicians in real time when a job runs long or an emergency call arrives, covered in more depth in Arosplatforms’ guide to service call optimization.
- Prescriptive staffing suggestions that recommend headcount or shift changes before backlog age climbs, not after.
- Equipment health signals from predictive maintenance systems that shift a demand forecast before a failure turns into an emergency dispatch.
Validate ROI against forecast accuracy improvement, reduction in overtime hours, and turnaround speed on high-priority jobs, and confirm the system integrates with existing HR and dispatch data rather than running as a disconnected layer.
Where to Start This Quarter
Run the baseline calculation this week. Map where backlog age and travel time are worst, and pilot cross-training on your two highest-friction skill categories before touching the schedule. The sequence that works is measure, model, pilot, scale, in that order, never reversed. Territory fixes and buffer sizing usually pay off faster than a new scheduling algorithm.
— arosplatforms team
Where to Dig Deeper on Capacity Planning
For implementation detail beyond this playbook, Salesforce’s help documentation covers capacity-based resource configuration in field service settings. IBM Research’s service-delivery modeling paper is worth reading for teams managing large, multi-region service networks. For a broader grounding in the discipline, Gomocha’s overview of capacity planning and the Wikipedia entry on workforce management both cover the coordination layer that sits on top of the numbers. Systems integrators like Right Flow Solutions can help connect HR, payroll, and dispatch data into one unified view when the capacity plan outgrows spreadsheets.
If you’re ready to move from spreadsheet forecasting to a system that updates capacity models automatically, Arosplatforms builds custom AI operating systems that connect demand forecasting, technician scheduling, and equipment data into one governed platform, tailored to your existing field service stack.
Sources
- Service-delivery modeling and optimization - IBM Research
- What Is Capacity Planning for Field Service? - Gomocha
- Define Capacity-Based Resources - Salesforce Help
- Workforce management - Wikipedia
FAQ
What Are the Three Types of Capacity Planning?
Most frameworks split capacity planning into lead strategy (building capacity ahead of demand), lag strategy (adding capacity after demand materializes), and match strategy (adjusting capacity incrementally as demand shifts). Field service teams typically blend lag and match strategies, using a baseline-plus-buffer approach rather than committing to permanent capacity ahead of confirmed demand.
What Is the Best Field Service Scheduling Software?
The right platform depends on your fleet size, skill complexity, and existing systems, so there’s no single universal answer. Prioritize software with capacity-based resource settings, real-time dashboards, and constraint-aware scheduling over brand recognition alone, and confirm it integrates cleanly with your HR and dispatch data.
What Is the Formula for Capacity Planning?
Jobs per technician per day equals available minutes divided by the sum of time on site and travel minutes. Multiply that by technician count for total daily capacity, then divide forecasted daily job volume by jobs per technician and adjust by an availability factor to get required headcount.
How Do You Perform Capacity Planning?
Start by calculating baseline capacity from real job time and travel data, then forecast demand using historical patterns adjusted for seasonality.